Lifetime Performance (since March 2021*)
- Total Trades
-
5401
- Winning Trades
-
4370 80.9%
- Strategy
-
28.8% CAGR-15.4%
- S&P 500
-
8.3% CAGR-25.4%
* From March 2021 through August 2022, I ran 1-4 DTE as outlined below. Starting September 2022, I moved to 0-1 DTE. More performance here.
Welcome to WealthyOption.com!
This serves as a place to share a core trading strategy that is part of my investment portfolio. It's become one of my favorites over my 15 years of trading - and it's the first one that has led me to set up a website all about it!
This strategy deviates from the norm and is not what you're used to seeing. It's not for everybody. If that includes you, that's okay! I do hope that you can at least take away some valuable new information by reading. Enjoy!
Warning!
Please read all of the information here thoroughly to fully understand the ins and outs of the strategy.
If implemented incorrectly, this can and will blow up your account quickly!
Guide
As I lay out my strategy, I am going to assume that you have a basic understanding of options and the market. I'm going to use terminology that is foreign to a beginner. If that's you, I recommend familiarizing yourself with basic market and options trading before following my trading plan. I consider this strategy to be suited for intermediate options traders - somebody with at least a few years of experience. If you read this and run into something that you don't understand, then you're probably not ready to employ this strategy.
Cutting straight to the chase, this strategy involves selling out-of-the-money (OTM) weekly SPX puts 5-8x per week and buying them back for 70% profit before entering another trade. These are short-duration, 1-4 days to expiration (DTE), naked / uncovered puts and calls! There's a lot of risk on the table, but the expected return is worth it.
My inspiration began after discovering Karsten from EarlyRetirementNow.com and his series titled Passive Income Through Option Writing. I started trading his strategy halfway through 2019 in the form of put credit spreads rather than naked puts as BigERN at EarlyRetirementNow does it. My put credit spreads treated me incredibly well over an 18 month span. So well that I decided to document both the strategy and my full trade history here at wealthyoption.com.
After setting up this website and sharing with other traders, I was challenged in many ways, ultimately leading me to backtesting my own strategy to find faults and/or areas for improvement. It's those backtests that convinced me to drop the spreads and move to naked puts.
I allocate 80% of my portfolio to this strategy (based on assumed max risk). This is 4x leverage. Allocation and sizing are extremely important and covered in detail below. You can adjust your leverage based on your goals and risk tolerance.
Want to see what it looks like? Here are two backtests that show this strategy. The first one is how I actually run it, with puts and calls split out into 3 separate positions each (for 6 positions total). The second backtest is a simplified version that runs just one put and one call - better for somebody manually trading this.
We'll get to the meat 'n potatoes below. I wanted to go ahead and get the strategy's performance out there so that you can decide whether or not the return and risk is something you're interested in.
- Higher return and lower drawdown (long-term) than the S&P500
- Market agnostic - can make money in any market environment, including a bear market
- Systematic with no decision-making required
- Requires little time to manage relative to other active trading strategies (20 minutes per week)
- Can be automated for a completely hands-off approach
- Viable for small accounts ($25k minimum)
- Theoretical undefined max loss
- Volatile short-term (days to a week), underperforms relative to buy and hold when volatility (VIX) spikes
- Underperforms buy and hold in a strong bull market
- High trade volume (5+ round-trip trades per week)
- Requires high level options trading permissions
I sell SPX puts between 5.5-7.5 delta with 1-4 days-to-expiration (DTE). When I open a position, I'll enter a limit buy to close order at ~70% profit (30% of premium/credit received on entry). That buy to close order is good-till-cancel (GTC). I enter a new trade either when my buy order fills at 70% profit or at expiration if it doesn't fill and SPX expires in-the-money. My new position is 1-4 DTE at the same delta and profit target just like all others. I hold any losing trades all the way to expiration.
I sell SPX calls in the same manner but target 2-3 delta for these rather than 5.5-7.5 as with the puts. The calls have a profit target and are also held to expiration in the event that they do not hit their profit target first.
Don't worry, I'll go much deeper into the mechanics below.
I exclusively use SPX for the following reasons:
- 5 expirations available every week (one every day)
- Highly liquid
- Cash-settled. No underlying given to me on assignment.
- Low trading fees (for me personally - your mileage may vary)
- Beneficial tax treatment (60/40% long-term based on IRS 1256 contract straddles)
- Less "paperwork" to file for taxes. Futures and index options aggregate together on IRS tax forms, eliminating 200 line items from this trading strategy in a year
SPX will not work for everybody. Whether it's a lack of access to index options or a small account size, there are alternatives available which I'll discuss in the "Frequently Asked Questions" section at the bottom.
When I enter a trade, I immediately enter a buy to close limit order at its profit target. I do not touch that position again. When that buy order hits (or the position expires ITM), I will enter a new trade using the same parameters. The new position is the next closest expiration that is 1-4 DTE. I don't open any 0 DTE.
I do not enter at any special time of the day or wait on any particular indicators to enter. I always have a position on the table and enter new positions when my current one either closes at its profit target or is at expiration.
My short strike for puts is as close to 6.5 delta as I can get. I have run many backtests against all deltas, and 6-7 seems to be a sweet spot for return vs drawdown. A 6.5 delta strike is going to be around 2-3% OTM in low IV environments and as far as 15-20% OTM in high IV environments. Calls are 2-3 delta.
You can bring your delta in or out based on personal preference. Generally speaking, deltas farther out will result in lower return and lower drawdown/volatility, while those closer will result in higher return and higher drawdown/volatility. This is generally speaking. Strikes that are really close can result in negative returns pretty easily! Be sure you understand the risk that you carry with varying strike distances.
The following table is generally how I analyze backtest data to settle on parameters. The data is only current as of early 2022,
but the point is not to focus on the actual numbers but instead my methodology for choosing parameters. I like summary visuals such as this
because it is a great way to identify trends while also ignoring outliers. Continue reading below the table for my analysis.
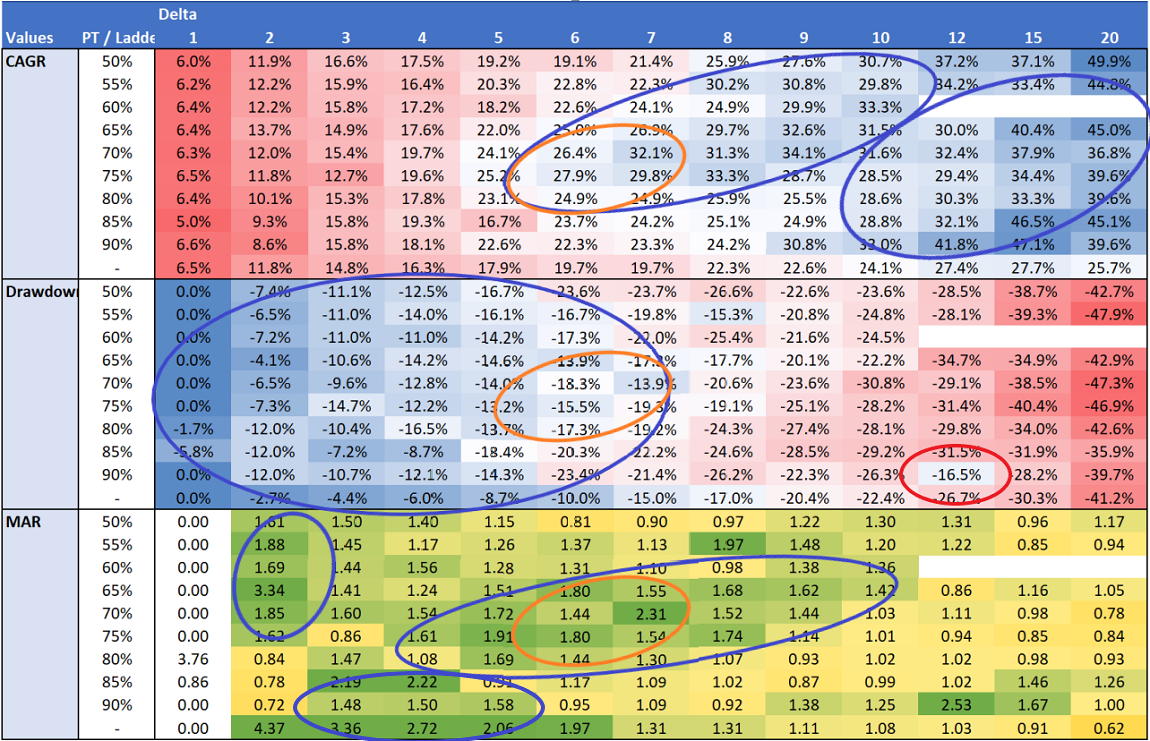
I have circled a few areas of interest. Bear with me on what is a pretty noisy graphic.
- Blue circles: Grouping of best performers per category (CAGR, Drawdown, MAR)
- Orange circles: Where best performers overlap (a venn diagram of sorts)
- Red circle: An outlier
When I want to select parameters for a strategy based on backtests, I view the results in this format and identify trends. There is a lot of noise between individual backtests, where, quite literally, minutes between different entries can make a difference in the final number. There is no way to know which parameters will be impacted going forward, and the best way to minimize your exposure to this is to find a large zone that performs favorably across many similar parameters, and define your parameters close to the center of that group. The blue circled areas all perform well, but the orange circled areas are where performance is solid in all 3 categories. That's where I want to focus my strategy, and that's how I ultimately settled on 5.5 - 7.5 delta and 69-74% profit targets. By spreading my parameters out in that area, I'm increasing my chances of achieving high performance in all three categories while also reducing some of the noise (luck) by distributing across multiple parameters rather than going all-in on one set of parameters.
I circled one cell in red: 12 delta, 90% profit target. If you're like many people, you'll scan through the backtest list and cherry pick the single best performer and run with that. This is problematic because that best performer is almost certainly going to be an outlier. There is an element of luck involved when running this strategy. Usually it is muted over the long-term, but sometimes it is not. The current state of this 12 delta, 90% profit target backtest is a good example of a backtest that has been the benefactor of some lucky trades. I scanned through the backtest trades and narrowed it down to primarily January and February 2020 when the 85% profit target had much less fortunate timing than the 90% profit target.
This should be a red flag if you're focusing in on 12 delta, 90% profit target. Look at its neighboring backtests (12 delta/85%, 12 delta/80%, 10 delta/90%, 15 delta/90%, etc.). Those neighboring backtests should show similar results to the one you're looking at. If all of the neighbors have similar results but the backtest you're looking at is on an island, then you're dealing with an outlier. Going forward, you should expect that backtest to generally perform like itself and those around it. Looking at the table above, I'd expect 12 delta, 90% profit target to generate somewhere around 35% CAGR with 30% drawdown - not 42% CAGR and 17% drawdown as shown in the table.
These are naked puts. Technically speaking, risk is undefined.
You should operate under the assumption that the underlying could go to 0, right?
No!
Be realistic here.
First, we're dealing with SPX which represents 500 of the largest companies in the world. They're not going to go to zero, period. In the event that I'm wrong and they do, then either an asteroid has hit and ended humanity or the human race has nuked itself off the face of the earth. Either way, if SPX goes to zero, you won't be around to worry about your money.
Second, the absolute longest that you are going to be in any position is 2 trading days. The S&P500 has automated circuit breakers built in which halt all trading for the day if the index falls 20% from the previous close. This means that the absolute most that SPX can fall for any one of your holds is 40%. This would require that you buy at the very top on day 1, and SPX hits the max circuit breaker 2 days in a row. The S&P500 has only fallen 20% in one day once during its entire history! Just once. What are the odds that we could go from once in all of history to 2 days in a row?
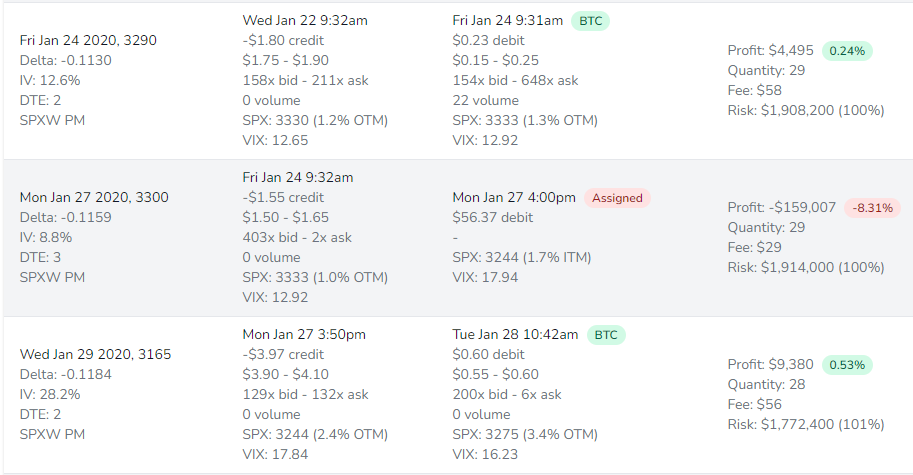
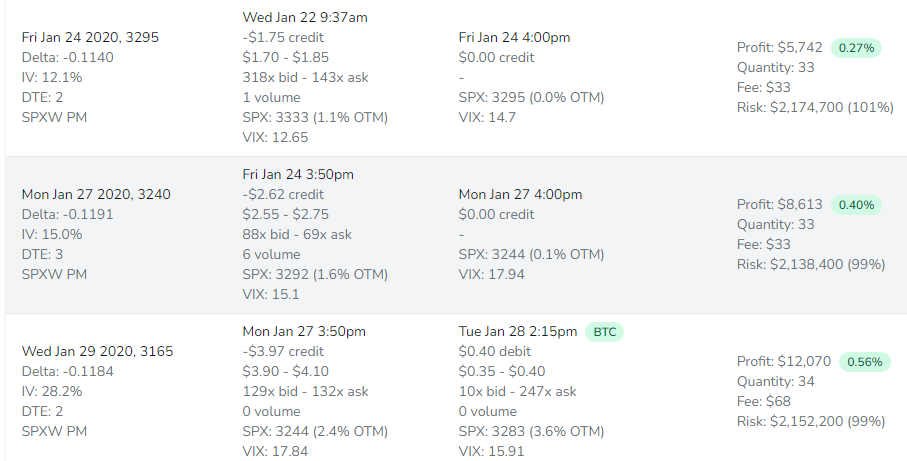
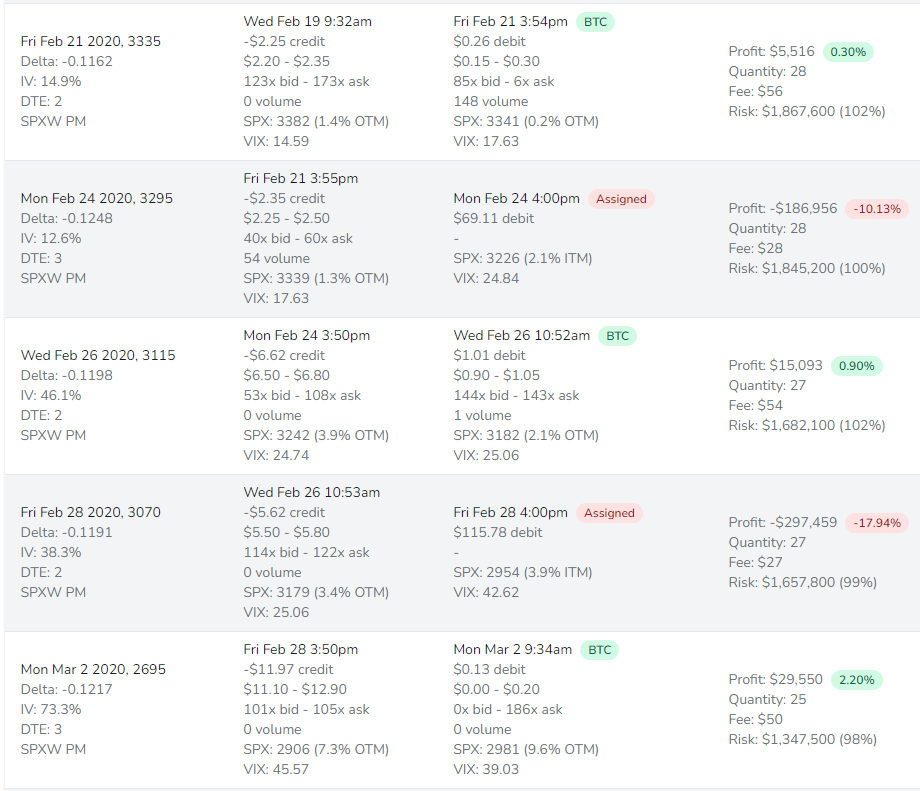
Third, in the event that SPX has some kind of nasty selloff, with how rapidly my trade adjusts to changing IV (by cycling in/out every 1-2 days), that short strike absolutely flies away from the current market level as selling accelerates. Don't believe me? What if I told you that I ran my more aggressive spreads (very similar to this) when the stock market had its third worst day in history, and I didn't lose a dollar? How is that possible?
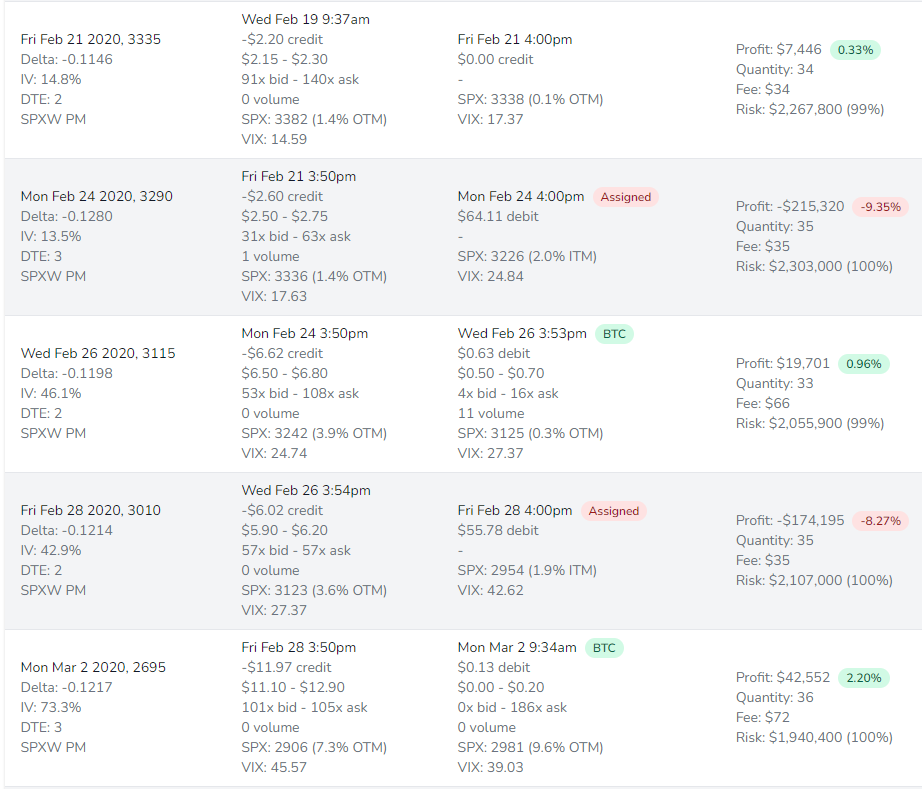
It's because heavy selling doesn't come out of absolutely nowhere like most would have you believe. It is always prefaced by at least some bubbling under the surface. That bubbling is enough to start pushing your short strike farther and farther away from the current price level. Before you know it, the market is puking its guts out but you're actually making money because your short strike is 15% below the current price level! Go look at my performance when I was trading in March 2020 and you'll see. Or take a look at these backtest results for to see just how far away the strikes were in March 2020.
For evidence of my claim that the market doesn't crater out of absolutely nowhere, take a look at the following two tables that were contributed by a reader.
The following table shows the likelihood of a certain percentage drop in SPX over a 2 day period under different volatility environments.
This assumes that you enter near market close for a position that is 1 day to expiration (ie: enter Monday at 3:30pm for a position expiring Wednesday).
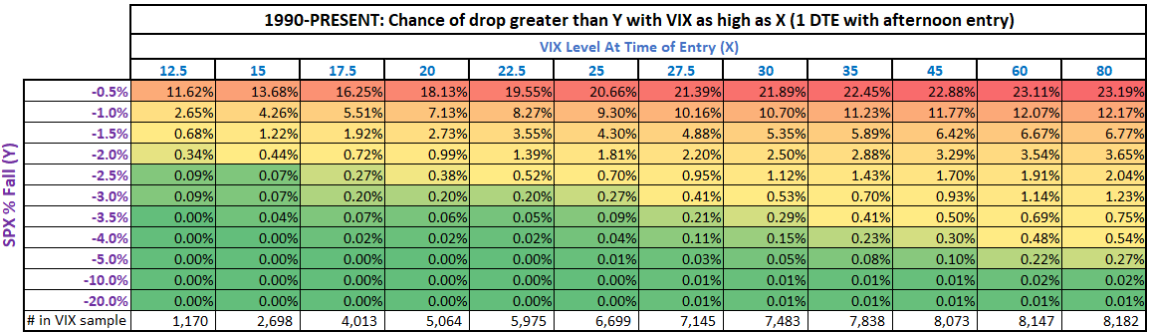
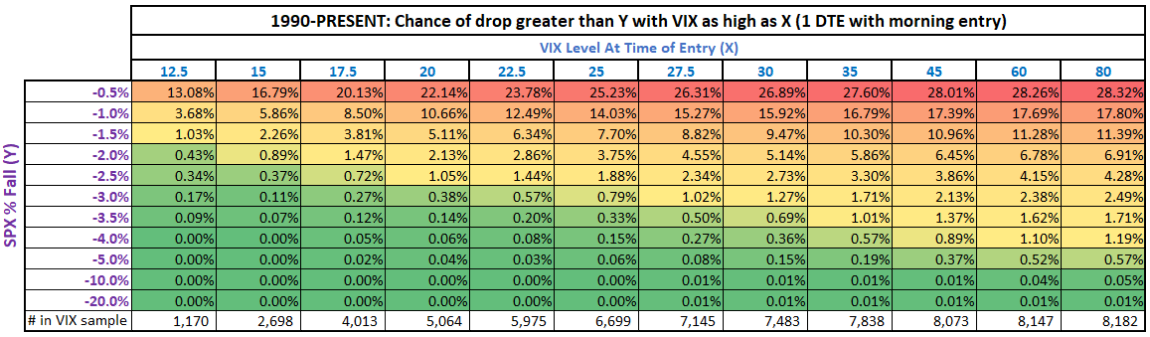
What if you enter first thing in the morning for a position that expires in 1 day? You're in the market longer in this case, so it has more room to fall.
An example would be entering first thing Monday morning for a Wednesday expiration.
You're exposing yourself to a little more duration here because you have 2 full trading sessions but still only 1 overnight gap. The risk of larger
declines does go up some in this scenario, but not much.
So. We know SPX isn't going to 0. We know it's not going to see two 20% loss days in a row. And we know that even when we do see a huge daily loss, our strikes are going to be so far away that not only is there a good chance we don't lose any money, but there's actually a decent chance we make money when that happens. If all of this isn't enough to convince you that the "catastrophic loss" just won't happen, then this trade isn't for you. And there's nothing wrong with that.
If you're still on board after reading the Max Risk section above, we can now go over how to size your trades. How many contracts do you sell to open?
I operate under the assumption that max risk for any one play would occur if SPX fell 20% below my short strike. This isn't 20% below my entry price, but 20% below my short strike. Any time you see "max risk" next to one of my trades or backtests for a naked position, it is based on the value I must pay to buy back my put if it expires 20% ITM. I consider this a fair, and conservative, assumption.
I backtested this trade over 6 years and 3000 trades, and the deepest any of those trades expired was 3.2% ITM in April 2022. This included a period with a 35% drawdown in SPX and the third worst single day loss at 12%, and still, the deepest ITM a position expired was 3.2%. I feel 20% is more than conservative enough. If you don't agree and you think it's 30%, then modify your trading plan to account for that.
Once you settle on what you consider to be a realistic max loss, then that max loss is how much of your portfolio you need to allocate per trade. If we operate under the assumption that max loss is 20% below your short strike, and your short strike is 3000, then max loss for that trade would be $60,000 per naked put. That's 3000 * 100 * 0.20. The 100 is for the number of SPX "shares" that each option contract represents.
You take however much of your portfolio you are allocating to this trade, and divide that by your assumed max loss per contract. If you have a $200,000 portfolio and want to allocate your entire portfolio to this strategy, then you would divide $200,000 by $60,000 to come to 3.333 contracts. So you'd sell 3 puts. If you only want to allocate half of your portfolio, then just divide half of your portfolio's value by max loss per contract.
How much can you safely run?
I honestly do believe this could be run safely at 100% allocation. But in the interest of full disclosure, I only personally run it at 80% allocation (which equates to 4x leverage). Despite how good my personal experience, backtests, and prior research is, I'm not ready to take the plunge at 100%. But I do think it's safe to do so. I think 100% allocation (5x leverage) is fine, but I don't recommend going much higher than that. If you do, be sure to purchase some tail risk protection.
Allocation Calculator
For help on assembling an appropriate number of contracts and positions for your account, take a look at my allocation calculator.
Backtests show that you always want to carry your puts overnight. Overnight is when we make most of our money as put sellers. If you're going into market close with a position that is in-the-money (ITM) that's not going to hit your profit target, you need to figure out how to get into a new position so that you benefit from overnight gains.
You have a choice between:
- Hold your existing ITM position all the way to expiration and STO a new position so that you double up at the end of the session
- Buy cheap puts expiring today to convert your ITM naked position to a spread, and then STO a new position
- Manually buy back your existing ITM position before market close and then STO a new position
#1 is my preference. But to do this, your portfolio must have enough buying power available for temporary 2x exposure for your puts. Don't worry about perceived double the risk. This doubling-up should be done as close to the end of the market session as possible. Your ITM position has minutes to go until expiration, so it's basically already at the largest loss it will see. SPX is cash-settled, meaning you aren't assigned shares at expiration. No worries about waking up the next morning with a bucketful of SPX shares. That said, if you are running SPY, you should not carry puts to assignment. You should instead go with #3 above.
Doubling up your puts position will require that you're running no more than 60-70% or so allocation (3-4x leverage). If you're running naked puts much higher than that allocation, you may not have enough buying power at the end of the session to double your exposure. If this is the case, you can either convert your existing position to a spread (#2) or BTC your existing position at a loss (#3) and then immediately STO a new position.
To convert your naked position to a spread, buy some cheap puts for the current day's expiration. Buy the first strike with the cheapest asking price. This will offset a significant portion of your used up buying power and will free up enough buying power to STO a new position for next expiration.
If you don't want to buy puts to convert your current position to a spread, you can simply BTC your current position at a loss. This frees up all buying power so that you can STO a new position as normal. Beware of poor liquidity right at expiration for your expiring position. I recommend BTC on a ITM position at expiration somewhere between 3:45-3:55pm ET if you can swing it. You want to do it near end of the session, but liquidity starts to evaporate quite rapidly the last few minutes, and you'll lose a significant amount to slippage when buying back if you wait too long.
As to whether you buy cheap puts to convert to a spread or BTC your current position, just go with whichever one you are more comfortable with. The important thing is to make sure that you STO a new position before market close. Volatility is high on these days. You want to sell volatility into close.
In addition to naked puts, I also run naked calls using similar parameters. The calls are not a hedge, and they are not a primary source of income or growth. My naked call backtests suggest positive expectancy on low (1-3) delta calls. When bundled with puts, "strangles" offer higher returns than just the puts by themselves.
The naked calls and naked puts both operate on their own schedule and profit target. They do not go on and off like a true strangle, because they each have their own ideal parameters. I do not enter any new naked call positions after 3pm ET on any day. I do this because of backtest data. Backtests suggest that there's a disadvantage in selling calls late in the day thanks to the market's tendency to experience overnight strength and gap ups. Rather than enter late in the day and expose myself to overnight bullishness, I wait until the next morning to enter new naked calls if I exited existing calls after 3pm. The impact of entry time for naked calls can be seen in the backtest list linked above.
I only recommend adding naked calls if you are on portfolio margin. If you are on portfolio margin and already running naked puts, an equal number of naked calls will require no (or very little) additional buying power. If you are not on portfolio margin but on Reg-T margin instead, adding naked calls will require full buying power, and this is a very inefficient use of capital!
If you'd like to add naked calls, I would recommend just looking at the naked call backtests to decide which best fit your goals. I run both 2 and 3 delta naked calls, at 78% and 83% profit targets. As with my puts, I only run multiple deltas because it is easy for me to do so with my autotrader. Running just a single delta is perfectly acceptable. The slight difference in profit targets is based on backtest data.
If the thought of undefined risk on the call side concerns you, and you're worried about the market blowing past your call strike, consider the following two tables for historical
reference as to the size of SPX moves in different VIX environments. The first table shows the likelihood of a certain percentage rise when entering near market close and
1 day to expiration. (ie: enter Monday at 3:30pm for a position expiring Wednesday). The second table is also
1 day to expiration but morning entry instead, so you have closer to 2 full trading sessions (ie: Monday morning through Wednesday expiration).
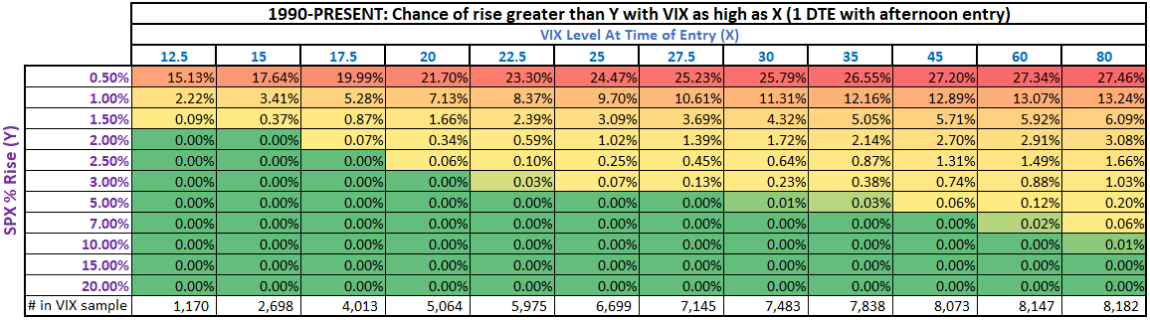
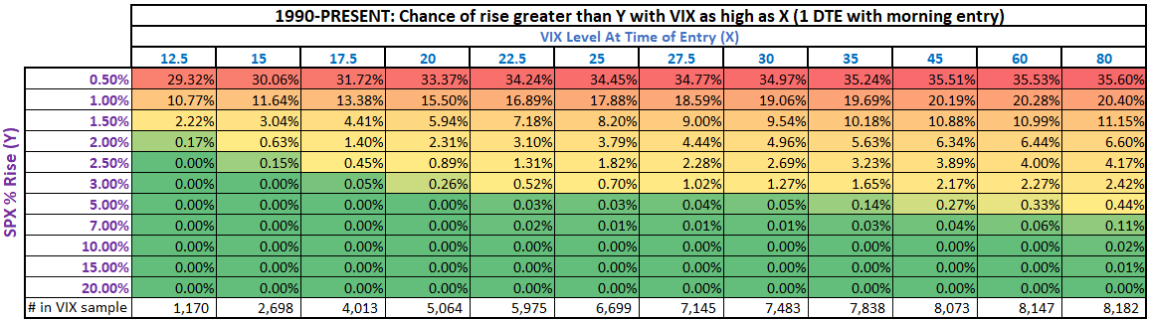
Keep in mind, as IV rises, your call strikes will push farther and farther out-of-the-money. In these 50+ VIX environments, you can expect your call strikes to start 10% out-of-the-money.
Because of the leverage that this strategy carries, when things turn south, losses pile up quickly. These losses are like a snowball rolling downhill. Buying power and solvency could be a problem for some who run this, depending on the parameters used and the rest of your portfolio. Finding peace of mind could also prove difficult, even in the good times as you wonder what'll happen when the market gets ugly.
If this is you, there are options available to slow or stop the bleeding.
Reduce Leverage
One of the easiest ways to reduce risk is to simply reduce the size (number of contracts) you carry. Leverage is, by far, the biggest risk contributor to the WealthyOption strategy. If you run at my maximum recommended allocation, you're running 4-5x leverage. What this means is that when it hits the fan, and you are deep in-the-money, your account will drop 4-5x faster than SPX itself. Don't want to move down 4-5x faster than SPX? Reduce your leverage. By doing so, you will also lower your total return, of course.
Spreads
Spreads (instead of naked) are another effective way to protect directly against the risk this strategy carries. That protection is probably the best you'll get, but it's also the most expensive. If you do put on spreads, resist the urge to increase contracts or delta because your risk is now defined. Doing so can result in more realistic risk than you had otherwise. Spreads will reduce your total return significantly, and that's why I don't run them. In the event of a single day black swan, however, a spread offers the best protection. Note that if a black swan spans multiple expirations, spreads may offer little protection because you must continually purchase new protection (increasingly expensive) with each expiration. A black swan is likely to last more than a day or two. If you're like me and want more than a day or two of protection, then you need something with longer duration than spreads, which leads me to ...
VIX Calls
I originally got the idea of a VIX hedge from Option Alpha. What they recommend is buying cheap VIX calls far into the future. Option Alpha recommends purchasing VIX calls once a month, 120 days to expiration, and holding the calls to expiration. By doing so, you're holding a "ladder" of VIX calls. You hold up to 4 different monthly expirations at a time.
What these VIX call ladders do is provide a safety net for the once in 10-20 year bear market events. I'm talking about deep (40%+ corrections) with VIX hitting 80+. These VIX calls will not provide much protection for 5-10% market corrections. That's not considered a "black swan". Likewise, 120 DTE hedges are not ideal for overnight (or weeklong) black swans, which is a bigger threat for my strategy. For that, you need to purchase protection at a closer date, which I discuss a couple paragraphs below.
The reason to purchase a ladder rather than just buy all of your protection at once is simply to reduce your exposure to timing. Rather than build a 120 DTE ladder, let's say you just buy VIX calls every 60 days, about 60 DTE each time, and hold to expiration. Now imagine purchasing one set on January 15th with expiration March 15th. March 10th rolls around. You're holding your March 15th calls that were purchased in January, and boom, black swan hits. Unfortunately, black swan protection that was purchased 2 months ago and expires within a few days, won't provide much protection anymore. However, if you had laddered multiple expirations, some of them would have better purchase dates and offer good protection.
Appropriate Duration for WealthyOption
Search around online, and you'll find most literature on tail risk protection and VIX call ladders to focus around 120 days to expiration. These are good parameters for most traditional (buy and hold) portfolios, or even a 45 DTE Tastytrade style strategy. This will provide protection against a tech bubble, financial crisis, or COVID pandemic type event.
The WealthyOption strategy, however, is not like most. My trade duration is very short (1-4 days) and then resets with each new trade. What this means is that I don't really need protection 120 days out. Rather, I need some very near-term. The big risk to my strategy is an overnight black swan. Think stuff like nuclear launch, EMP, solar flare, cyber attack, Yellowstone super volcano, asteroid, surprise invasion by a world power, etc. As crazy as these things sound, they are the biggest threat to my trades - not large scale economic fallouts.
Modifying a 120 DTE call ladder to an appropriate duration for my strategy, I prefer taking the same mechanics used to assemble a 120 DTE strategy once a month but instead use ~23 DTE, purchased weekly. You can purchase these every Monday, targeting the weekly expiration that is 23 DTE (expiring Wednesday in 3.5 weeks). Consider something like 5 delta VIX calls. The liquidity isn't great on VIX weeklies, but it's good enough for this purpose. This ensures you always have at least 3 tranches of VIX calls on. Initially, one expiring in 2 days, one in 9, one in 16, and the newest in 23 days. When the first one rolls off, you still have 3 on until the next purchase. VIX calls expire every Wednesday morning. This is just an example of how to set up a VIX call ladder with a shorter duration. There are other ways to do it.
VIX Call Size
If you're wondering how many VIX calls you need to purchase to provide the right protection against ___ number of SPX puts, I don't have a good answer for you! Since there's no precedent for the black swans that these calls are offering protection against, there is no basis for how much protection they offer. Rather than wrestle with this, I think the easiest approach is to simply ask yourself how much CAGR you are willing to give up per year to insurance. Maybe that means spending about 1.5% of your portfolio per year on tail risk protection. If you buy VIX calls once a week, this means 1.5% divided by 52, which comes out to about 0.03% per week towards VIX calls. Don't worry if it sounds so small that you won't even be able to purchase a single call. These things are cheap, like $0.20 a pop ($20).
You might need more than 1.5% per year, you might need less. One thing I like about framing this with "how much do you want to give up per year?" is that the more risk you carry, the more you should be willing to give up (since your return is higher), and the more protection you need to have in place as well, considering your risk exposure.
So what do VIX calls do? VIX calls explode in value when VIX spikes. These will provide a significant boost to your account value when you need it most. It may or may not save you from a margin call. Spreads are really the only way to ensure that. VIX calls will significantly reduce your drawdown during a black swan, at the cost of a slow and steady drag when there's no black swan (which is almost always).
When to Take Profit
When do you cash in your insurance plan? Since there is no prior event in history where these VIX calls were needed, it is difficult to determine in advance at what point to take profit. With longer duration protection, you can look back at 2008 and 2020 and determine optimal profit targets for those events (50-80x profit target seemed optimal), but there are no events to look back on for short duration black swans. As such, I have no defined profit target and will just assess if/when the time comes.
These Don't Have to Profit to Work!
While profiting from a hedge (insurance) is something worth striving for, it is not necessary to profit from your hedge for it to help your growth. Volatility/variance drag does a lot of harm to long-term growth. If your portfolio loses 50% of its value, you need 100% return to get back to the previous high. If you can reduce that drawdown from 50% to 40%, you now only need a 67% return to get back to your previous high! Even if all your hedge does is cost you money, and you never sell it for a profit, you can still end up with more money vs not carrying a hedge at all. For a good read on this, check out this thread on Twitter.
No Historical Precedent
While markets have experienced black swans of longer durations (tech bubble, financial crisis, COVID), there's really only 1 event in history that would have seen significant protection from a 30 DTE VIX call ladder, and that was 1987's Black Monday. That is the type of event that is the biggest risk to my strategy and also the type of event that I'd build my VIX call ladder around. Because VIX calls didn't exist in 1987, and because there has been no similar event since, any backtest for a 30 DTE VIX call ladder is going to just show negative drag with little to no realized profits. This doesn't mean it's a poor hedge or that it doesn't work. It just means it hasn't been necessary - yet.
I was originally just selling 6.5 delta puts for every trade. There is nothing magical about 6.5 delta in particular. But after looking at the backtest data and considering my personal growth goals and risk appetite, 6.5 delta was the most attractive to me. That said, 5 and 7 deltas do grab my attention for different reasons. But I have to pick just one - right? Wrong. I expanded my autotrader to run multiple deltas simultaneously if I'd like to, and I am now doing just that.
The nature of this trade is that you're going to realize a lot of very small wins, and then, you're occasionally going to get run over by the steamroller. When the steamroller hits, your account will suffer a large shock, and you will inevitably climb out, but the initial loss is painful. In my head, it makes sense that if you can stagger your entries, those steamroller blows won't be as large. They may happen more often (because you're in more trades), but the magnitude should be smaller. The thought process here is similar to dollar-cost-averaging in traditional investing.
After thinking through this, I decided to transition from my full allocation at 6.5 delta puts to divide my allocation between 5.5, 6.5, and 7.5 deltas. This comes at no additional cost, whether it be commissions, taxes, or time (the latter thanks to my autotrader). My goal here isn't to generate higher returns or lower drawdowns, but, fortunately, my initial backtest data suggests that staggering like this could very well increase CAGR and/or reduce drawdown. Without spending too much time digging into the results, I suspect that the largest contributor to this phenomenon is less portfolio volatility drag.
See below for some rudimentary backtest data showing this phenomenon. I will spend more time on these backtests in the future.
| Delta(s) | Trades | CAGR | Drawdown | MAR Ratio (CAGR / Drawdown %) |
|---|---|---|---|---|
| 5.5 (backtest) | 1673 | 19.2% | -17.1% | 1.13 |
| 6.5 (backtest) | 1751 | 23.4% | -19.6% | 1.20 |
| 7.5 (backtest) | 1847 | 23.6% | -20.0% | 1.18 |
| 5.5, 6.5, and 7.5 (backtest) | 5271 | 22.6% | -17.9% | 1.26 |
| Delta(s) | Trades | CAGR | Drawdown | MAR Ratio (CAGR / Drawdown %) |
|---|---|---|---|---|
| 2 (backtest) | 1397 | 3.9% | -4.3% | 0.90 |
| 2.5 (backtest) | 1338 | 4.2% | -5.6% | 0.76 |
| 3 (backtest) | 1299 | 5.4% | -6.3% | 0.86 |
| 2, 2.5, and 3 (backtest) | 4034 | 4.5% | -5.3% | 0.84 |
Running just one delta is fine! You don't need to run multiple deltas. But if you are able (likely thanks to an autotrader) and the possible advantages of doing so appeal to you, I say go for it.
I strongly recommend running my strategy as outlined above using naked puts and calls. However, if you are running this in an IRA or do not have permission to run uncovered positions, then you can run put credit spreads instead and do quite well. This is actually how I started off with this strategy, using put credit spreads instead of naked puts. I did this because the thought of undefined risk was too scary for me. It was after backtesting the strategy and comparing naked puts vs spreads that I decided to move to naked puts instead. The spreads very rarely, if ever, provide actual protection. If they do offer protection, it is probably because you are using a narrow spread, and this eats so far into your profit that it isn't worth running the strategy.
How wide should your spread be? Make it as wide as you can go. The ideal would just be the cheapest strike in the option chain. For SPX, this might be 400-500 points out. That's fine. Find the first strike that will cost you $0.05. The goal here is not to find protection. The money that you spend on your long strike is not going to protect you on these trades, so you should spend as little on it as possible.
If you run spreads, I recommend sizing them as if they were naked. So, do not allocate based on spread width. Instead, allocate based on notional (20% below your short strike). What this does is keep your total leverage in check. Your leverage, in my opinion, should be no greater than 5x when running this strategy.
Resist temptation to narrow your spread to "reduce risk". My extensive backtests show that narrow spreads significantly underperform wide spreads. A narrow spread carries a lower total max risk per spread, but what most traders will do is simply increase the number of contracts they carry on a narrow spread so that they carry the same total risk that they'd otherwise have on a wide spread with fewer contracts. The narrow spread with more contracts carries more practical risk!! This is because you will experience max loss on a narrow spread much more often than you will a wide spread. Why? Because max risk is realized when your long strike is breached, and on a narrow spread, your long strike is much closer! Go as wide as you can on your spread, always. The long strike on the spread for this strategy is not for protection.
As outlined above, the above strategy results in a lot of trades (5+ round-trip per week) and may not be ideal for somebody who doesn't have quick and convenient access to a phone or a computer throughout the day. You need to be available to enter a new trade either when your profit target hits or at expiration when a position expires ITM. Entering a new trade should take no more than 5 minutes, but you never know when that will happen.
Considering the mechanical nature of this strategy and the frequent but irregular attention required to manage new trades, I went as far as automating the entire trade. I integrated with my broker's (TD Ameritrade) API and have a process running during trading hours that will automatically enter and exit new trades exactly as I've laid out on this page. This won't be a viable option for everybody, but if you have the resources, this is certainly something you should consider.
This strategy benefits from a phenomenon called Volatility Risk Premium, which has existed as long as options have, and is particularly magnified in index options. Volatility Risk Premium (VRP) is a known premium that is priced into options to compensate the option seller for the asymmetric risk profile that they take on. This assymetric profile means that the sellers stand to profit a small, fixed amount on their trade, but stand to lose a considerable (sometimes infinite) amount. In exchange for this unfavorable profile, sellers demand premium in return, and buyers are willing to pay the premium to be on the favorable side of the return. Both parties know and acknowledge that after this premium is included, options are simply overpriced. And that's how you collect money over the long run by mechanically selling them. This premium effect is magnified the farther you go out-of-the-money, which is why I focus on low delta strikes.
So who's buying all of these puts and calls? If it makes money so well, why don't more people do it? For starters, the reason your neighbors and co-workers don't do this is because it's well out of their reach. If you're reading this, you know more about markets and trading than 99.9% of the general population who never have and probably never will touch an index option. The reason that funds, banks, institutions, etc. do not sell these is because they are the primary customer. These large prop firms, hedge funds, investment banks, etc. are very risk averse. They do not like to take on asymmetric risk and will go to great lengths and expense to avoid significant losses. It's one thing if you blow up your own portfolio, but totally different when you blow up your employer's. To help smooth returns, institutions purchase tail risk protection (which is what I sell!).
On top of this, you have dealers/market makers who sell to counterparties. These dealers carry large books of options, and they want to remain as delta neutral as possible. To protect themselves from dangerous gamma traps on large moves, dealers will purchase far OTM puts (and to a lesser extent, calls) to act as a parachute should the market turn quickly against them. Short-dated options are the easiest, cheapest, and most direct way to hedge against near-term events. Whether a prop firm or a dealer, they buy these options in large quantities knowing that they will lose money long-term doing it, but it's simply viewed as cost of doing business. In addition to buying options to neutralize their exposure, market makers likewise will buy from you just to provide liquidity. They will buy without opinion or interest in market direction, but just to provide liquidity and make money off of the spread. They'll balance these positions using more options or other positions like futures contracts.
Backtests are notoriously bad at not reflecting reality. Sometimes this is from overfitting, which is specifically designing backtests to work best for your historical timeframe that is not reflective of the current or future environment. Sometimes backtests aren't accurate because the data is bad, the assumed fills are bad, or they don't account for slippage or fees. Sometimes backtests don't work because they lay out a trading strategy that is near impossible to actually execute in live trading. Backtests get a bad rap for good reason.
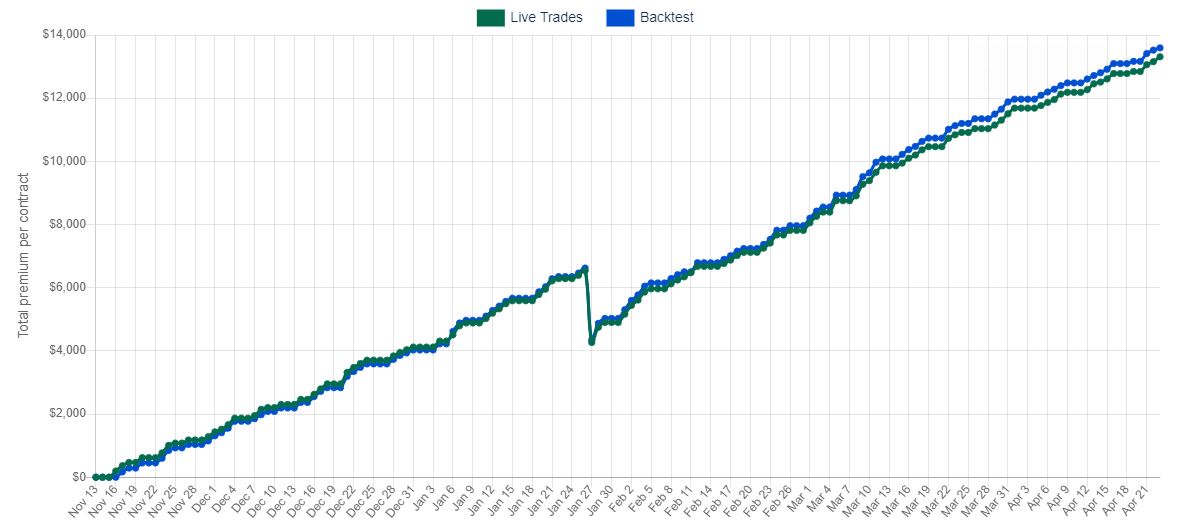
After much time and energy, I am confident in the accuracy of my backtests over the historical time period and also the
ability to translate their parameters to live trading. To further build confidence, I created a page that will chart and compare my
actual trades as executed by my autotrader against a backtest that uses the same parameters. Both use 6 delta short strike with 70%
profit target, and 5 months into live trading, the two have moved in near lockstep, although a slight modification to backtest fills might be
called for. If you'd like to run your own backtests, I opened up my own
intraday options backtester that's
available to the public.
I have witnessed a lot with regards to this strategy, whether through my own experiences or the experiences of others. I've interacted with thousands of people over this strategy and journeyed side-by-side with many of them. Through this, I've seen a lot of mistakes made. I'll cover some of the recurring mistakes or pitfalls here.
Too Much Leverage (Overallocation)
When things are quiet (which is most of the time), this strategy is boring. You're picking up pennies while everybody else is picking up quarters. This environment bores people and creates a false sense of security when you're not making much money and not losing any either. How do you fix this? Just leverage up of course. You're not losing any money anyways, so just juice your parameters so you're no longer only picking up pennies. This works until it doesn't, and the market will return with a vengeance when you least expect it. Do not overallocate or lever too high to chase returns when returns are low. This will come back to bite you, perhaps permanently.
Narrow spreads are the most common way to achieve too much leverage. After all, your broker will only allow so much naked exposure. Narrow spreads are great most of the time. But once you go in-the-money, you'll quickly realize when they aren't so great.
Giving Up After a Loss
This trading style is unconventional. And it can be volatile. While the long-term equity curve is smoother than the underlying market, short-term volatility can be higher. There will be times where you lose money quickly. But those losses will be short-lived, and you will recover from them (and much more) if you let the odds play out.
You're going to have hundreds of small winners and then, all of a sudden, boom, you'll have one loser that wipes out hundreds of prior trades. Despite all of the data and backtests that I provide, people go into this blind to the very real risk of black swan events - single days that wipe out months of returns. This is normal. But it continues to catch people off guard and actually surprise them.
Some people quit the strategy after one of these losses and revert back to buy and hold or some other active trading. Ironically enough, this is the exact opposite of what you should do to succeed. If you're at a casino playing slots, what should you do after you hit the jackpot? Should you quit playing or continue? When you trade the WealthyOption strategy and quit after a loss, it's almost as if you are going in with the goal of losing money.
"I'm going to keep trading this until I lose money, and once I lose money, I'll stop."
For the trades to work, you must be consistent and stick to them. It's not easy for many traders to just trust the process, and if that's you, this trading plan is going to be difficult to stick to. The short-term satisfaction isn't great. It's the long-term, over months and years, when consistency rewards you.
Rolling In-the-money
This is addressed in the Frequently Asked Questions, but I feel it deserves mention here as well. Once you're assigned in-the-money at expiration, it is imperative that you move to your target delta for the next expiration. Don't hold the strike and roll for a credit. SPX will eventually recover, yes, but it may not do so soon enough for you to recover. You can only hold a position in-the-money at 3x+ leverage for so long before liquidation. This isn't just something I believe in philosophically or on principle. It is a mistake I have personally witnessed others make, sometimes leading to account destruction.
Timing the Market
My strategy is market agnostic and relies on mechanics and the law of numbers to work. There are no directional or judgement calls to make. Despite this, people tend to listen to their gut and adjust trades based on where they think the market is going. This leads to either missed premium (by sitting on the sideline) or magnified losses (by bailing early at a stop loss only to watch the market later recover).
Anecdotally (since it's difficult to measure), my observation is that these people end up with less money in the long-run. They'll get some calls right, sure, but not consistently. The other thing that this reliably introduces in added stress and second-guessing. The amount of stress that market timing adds should not be ignored. Even if you end out ahead, is it worth all the stress and time that came with it?
I'm generally a believer in nobody knowing the direction the market is going, particularly short-term. I won't hop onto a soapbox over this but just state that's my belief having actively traded for over 15 years, including technical analysis and scalping. If you do know where the markets are going, hats off to you. You should also know that selling far out-of-the-money options is not the best way to capitalize on direction. It's probably the worst.
You're probably lost at this point. You should be! This is a major data dump. Here's a quick recap of what I actually ran in my portfolio. You don't need to copy everything here in order for it to "work". In fact, unless you have a pretty advanced autotrader, you'd be crazy to make these trades manually. If that's you, just run 1 delta for puts and 1 delta for calls.
| Trade | Delta | DTE | Profit Target | Allocation |
|---|---|---|---|---|
| Naked Put | 5.5 | 1-4 | 74% | 25% (1.25x leverage) |
| Naked Put | 6.5 | 1-4 | 72% | 30% (1.5x leverage) |
| Naked Put | 7.5 | 1-4 | 69% | 25% (1.25x leverage) |
| Naked Call (no entry after 3pm) | 2 | 1-4 | 78% | 25% (1.25x leverage) |
| Naked Call (no entry after 3pm) | 2.5 | 1-4 | 80% | 30% (1.5x leverage) |
| Naked Call (no entry after 3pm) | 3 | 1-4 | 83% | 25% (1.25x leverage) |
| VGSH Shares | N/A | N/A | N/A | ~90% account balance |
-
This should work on SPY, XSP, and /ES (S&P futures) weekly options. If you opt for something other than SPX, be aware of the following possible differences:
- Size (contract multiplier for the underlying)
- Early assignment (American vs European style)
- Settlement (cash or shares)
- Tax on gains
- Transaction fees
- Expiration dates and liquidity
- Available strike prices
The way that options are treated can vary greatly. Rather than go into detail here on all the different combinations, I urge you to familiarize yourself with handling of SPY, XSP, and /ES options if SPX doesn't work for you. You should, at minimum, consider the factors listed above.
-
My max risk for each trade is based on my position expiring with SPX 20% under my short strike. While, technically speaking, SPX could fall more than that, realistically it cannot. You can read more about my thinking behind this in my section above titled Max Risk.
-
Read my section on Max Risk. While the chance of this 50% fall is not '0', it is as close to 0 as you can get. You can adjust your portfolio allocation or max risk assumption to whatever you would like to compensate for your own personal max loss event.
-
I have backtested stop losses with my strategy, and they universally underperform backtests without stop losses. I have included a wide range of stop losses as well - everything from 50% up to 10000%. In every case, the results are worse, whether that's CAGR, Drawdown, or both. The trades that I put on carry extremely high gamma. This means that the premium (price) moves very rapidly after entry. As a result, many trades observe large paper losses before turning to a profit. Incorporating a stop loss means you're locking in a lot of small losses, and immediately entering a new trade which is also at risk of being stopped out. Stop losses work with some strategies and mechanics, but not this one.
-
When running this strategy, you're leveraging your account 4-5x its value. This is a lot of leverage to carry every day, and it's only safe and possible because you are very quickly and consistently jumping out of trades and pushing your strike farther down as positions are challenged. If your positions are far out-of-the-money, you don't realize the full effect of leverage thanks to delta being so small. As you approach your strike or go in-the-money, you start to realize the full impact of your leverage, and it is intense.
Once challenged, SPX will eventually recover, yes, but will you still be solvent to see it?
Think back to my max risk assumptions and sizing that is designed around max risk assumptions. If one of my positions/strikes goes 20% in-the-money, then my account is done for, aside from tail hedges to soften the blow. Now - imagine you sell 1 DTE puts near SPX all-time-highs and you choose to roll any challenged positions in-the-money and maintain the strike because SPX will eventually recover. What if we enter a bear market, SPX grinds down 50% over 6 months, and doesn't recover for 2 years? When your positions are sized wherein your account blows up if 20% in-the-money, what's going to happen when you are 45% in-the-money after rolling for 6 months? Fortunately, your broker will have liquidated you long before then, but the point is that if you roll these positions in-the-money, I can confidently say that there is a 100% chance that this will eventually lead to ruin. It might be 6 months from now or it might be 6 years from now, but it will happen.
-
I use delta for strike selection and profit target for exit, that's it.
This trading strategy leads to a lot of small winners and a few big losers. The most effective way to boost returns would be to figure out how to avoid some losers. The problem is, they are impossible to predict.
I use delta to determine how far out to place my strike. Delta is a general calculation of the likelihood of that option expiring in-the-money. Many studies and my own backtests point towards delta being slightly overstated, but it remains a pretty good estimate of likelihood of expiring in-the-money. This may sometimes have you 2% out-of-the-money in lower volatility environments, and as high as 20% out-of-the-money in high volatility environments. Regardless of volatility and how far out-of-the-money you are, my extensive backtesting proves that the true chance of assignment is stable when maintaining the same delta. This is a pretty amazing phenomenon when you consider the fact that one number (delta) is moving your strike price 15% in or out and providing the same chance of assignment without you doing any math or work on your own.
This delta figure is calculated based on how all market participants are currently pricing SPX options. The SPX market is the most actively traded market in the world, and it isn't close. SPX alone makes up for approximately 40% of all US option notional traded on a daily basis. By going against delta and using your own indicator, what you are suggesting is that you know more about market direction than the trillions of dollars in the market. Behind that trillions of dollars are the smartest and most well-funded people and institutions in the world, with the backing of the best research, software, tools, and information available. If you think that you know better than these people, then you should use your own indicator. I will say that if you do know where the market is going, there are much better ways to make money on it than selling far out-of-the-money options!
If you do stick with delta as I do, trust that it places you where you need to be, and you need to accept that with every trade that you put on, you are taking on a certain percent chance of assignment. This percent chance of assignment is going to be roughly the same with every trade, regardless of market condition or volatility, as long as you continue to follow the same delta. If you're selling 6 delta options, go ahead and accept the fact that 3-4% of them will be losers, regardless of whether they started 2% out-of-the-money or 20% out-of-the-money.
-
For my actual trading performance, return and drawdown are based on profit/loss in raw dollars divided by my total portfolio size. Daily returns are added up to reach total return.
-
I'd argue $25,000 is about minimum to make this strategy viable.
At the time of this writing, 1 contract for SPY or XSP would carry about $9,000 max risk based on my 20% < short strike assumption. You could run up to 3 SPY contracts on a $25,000 portfolio and stay close to my recommended maximum allocation. The reason that I say $25,000 minimum and not something like $9,000 and just run 1 contract is because of pattern day trading rules. Regulations require pattern day traders to maintain a $25,000 balance, and you'll be designated a pattern day trader if you run this strategy.
If you do use SPY, don't forget about assignment and tax treatment. If your SPY put is ITM on expiration day, the likelihood of you being assigned shares is high! This can be an added headache. This is not true for XSP. It is treated just like SPX for taxes and assignment.
If SPX is too large but you can go bigger than SPY or XSP, look into /ES which is half the size of SPX. Consider factors other than size, such as commissions, tax treatment, and settlement (as covered above).
-
I always enter the next closest expiration that is 1-4 DTE. I don't enter any 0 DTE (options expiring on the current day). I'll enter 1 DTE if available. Otherwise, 2, then 3, then 4. 4 DTE is only used around stock market holidays.
-
After expanding the capability of my autotrader, I chose to shift from selling only 6.5 delta puts to 5.5, 6.5, and 7.5 delta puts instead. This is not necessary but something that I do because I'm able, and it does offer some benefits. You can read more about this in the trade process section.
-
If you are using something that is assigned with the underlying (like SPY and some /ES), then you should close out any positions at risk of assignment before close so that you avoid assignment. If you do not do this and are assigned shares, then you carry those shares overnight (or over the weekend) and can't open a new set of puts or you double your exposure. You can avoid this entirely by using SPX or /ES that are cash-settled!
-
My commissions on SPX are so low that I don't even factor them into my P/L. I estimate that about 1.5% of my total return is spent on commissions. While this is a measurable cost, it is not something that forces me to reconsider the trade. Commission will go up with SPY, XSP, and /ES, so factor this into your choice of a symbol to trade. If you do trade high volume (which this strategy will help with), I recommend contacting your broker to negotiate lower fees. I use TD Ameritrade, and while their fees are already quite low thanks to the low and no commission brokers (hey Robinhood!), I was able to talk TD Ameritrade quite lower than their low published rates.
-
Backtested over 4 years, max drawdown for this strategy was 10%. SPX over the same timeframe had a drawdown of about 35%. I'm unable to reliably backtest farther back than 2016 because SPX Monday, Wednesday, Friday weeklies didn't actively trade back then. I did some rudimentary backtesting on the weekly and monthly SPX options that were available in 2008, and max drawdown was still only about 11% over that timeframe. When the market collapses, you'll find that you have a large loss very quickly, but once that loss is out of the way, you'll be on the 'road to recovery' long before the overall market.
-
Your buying power requirements will vary based on your broker and account margin setup, but more likely than not, you'll find yourself with an abundance of buying power after implementing this. What you do with that remaining buying power is ultimately up to you. I'm not laying out a total portfolio strategy here, just one trading plan. You do with your remaining capital what makes sense for your investment goals.
For me, personally, at the time of this writing, I am allocating 80% of my portfolio to this put writing strategy. That 80% is the sum of my calculated max risk based on the number of contracts I am holding. This also happens to be 20% of the notional value held by my SPX contracts. If you prefer to speak in terms of leverage, this is equivalent to 4x leverage.
Considering that my account utilizes portfolio margin (which is more generous than "regular", Reg-T, margin), I have an absurd amount of buying power remaining. Selling puts doesn't actually require cash. When you sell puts, you still have all of your cash sitting around idle to do something else. I place almost all of my available cash in a conservative bond ETF, VGSH This is 1-3 year treasuries. It carries very little rate or default risk and will add another 1% to the portfolio per year right now (2021) and more if and when interest rates ever go back up. Be careful using your remaining funds on risky or highly leveraged products. The puts as I've outlined here are leveraged themselves!
-
I'm just a regular guy who worked in IT, benefited from some lucky outcomes, and retired in my mid-30s to raise my family and work this little gig on the side. I've been actively trading for 15 years or so, using options for close to 10 years. I've tried and seen a lot, but I'm not a pro! I tend to be a bit private in nature when it comes to revealing my identity online, which is why you won't see my name anywhere. If you manage to join the WealthyOption community, you'll find I'm an open book in many ways.
-
So why not just keep my head down and keep to myself? I've been through the struggle of being a new trader, and I've seen others struggle mightily with it as well. I've found something that is reliable and easy to follow and see a good opportunity to share with others who might be struggling. I enjoy helping and teaching others, so what better way than to offer free advice?
I could write a book, or sell this as an "eBook" or service, and that did cross my mind, but making money off of this just wasn't as important to me as sharing the info with others. If I'm being honest, I have gained financially through this site. Not by collecting money from you or selling your anything, but by discussing this with others and improving the strategy parameters. I've developed more and more research after sharing this, which has led me to incremental improvements that will improve my long-term returns.
I'm also a bit of a tinkerer and web developer. Setting up a website and trade log where I can easily log trades and track performance in my own way had some appeal as well. This is actually where the idea first started. I wanted to create a simple (private) trading log to easily track these trades. As I began working on it, I decided to go ahead and make it public and define the trading plan as well. Then came a backtester and autotrading. Who knows what's next!
-
If you like what you see and what to give back, donations are always appreciated but not expected. No, I don't need your money, but it could encourage me to at least keep the site going.
Something else I'd appreciate just as much is a quick message letting me know how this has helped you improve as a trader, or if you've got any advice for me to improve this strategy, I'd love to hear that as well! I know this strategy is far from perfect, and I'm always looking for ways to improve. If you have any suggestions or advice, let me know! Ideas for how to improve this website are also welcome.
Starting in September 2022, I transitioned from 1-4 DTE SPX puts and calls to a blend of 0 and 1 DTE SPX puts and calls. I made this move after extensive backtesting and study with a continued goal to generate returns that exceed the S&P 500 while reducing my exposure to tail risk.
This new strategy is far more advanced than what's published above on this page, and, as such, I do not reveal the details or mechanics of the new strategy to the public. It's just too complicated and dangerous for most readers. If you consider yourself an advanced trader and would like more information, feel free to contact me. I do occasionally grant access to others who I feel could benefit and also have an interest in joining our closed community of traders. It's nothing weird. I have no product or sales pitch, but we just like to keep the group small with a solid signal-to-noise ratio.
Below is a list of more reading material and resources to dig further into the mechanics behind my strategy.